Welcome to my write-up for the Perfectroot CTF 2024! In this post, I’ll walk through the challenges I tackled, sharing insights into my approach, analysis, and how I cracked the flags. Let’s dive straight into the action!
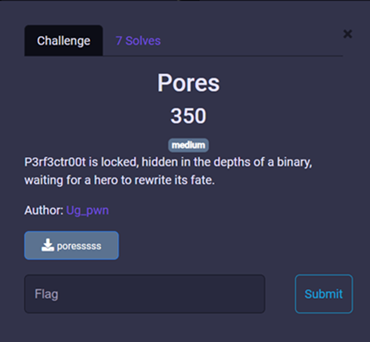
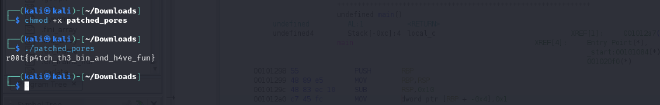
Before diving deeper into the analysis, I decided to execute the program to observe its behavior. I first made it executable using chmod +x poresssss then ran it using ./poresssss
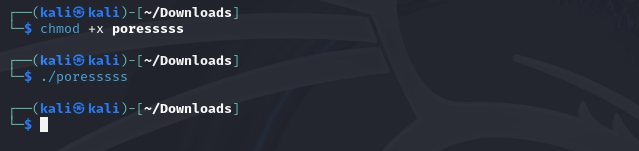
I ran strings to look for any readable strings that might give clues about the flag.
Among the results, I found the strings flag and printFlag. These stood out as potential indicators of where the flag might be stored or how to trigger its retrieval.
4. Using Ghidra for Disassembly and Decompilation #
I loaded the binary into Ghidra for further analysis.
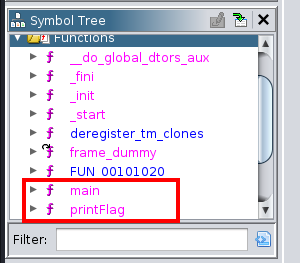
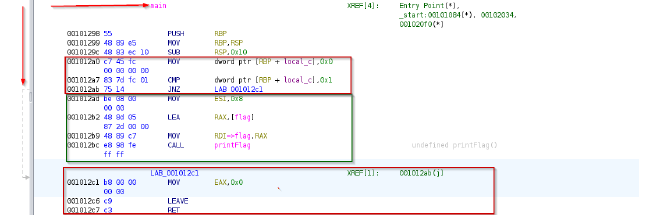
From the Symbol Tree in Ghidra, 2 functions of interest were main (program entry point) and printFlag (function to give the flag supposedly)
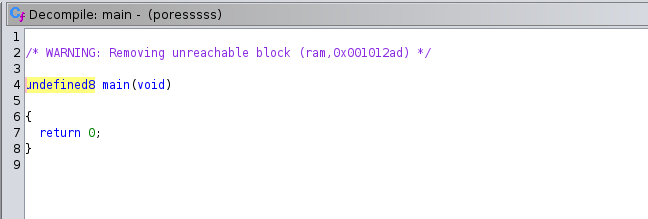
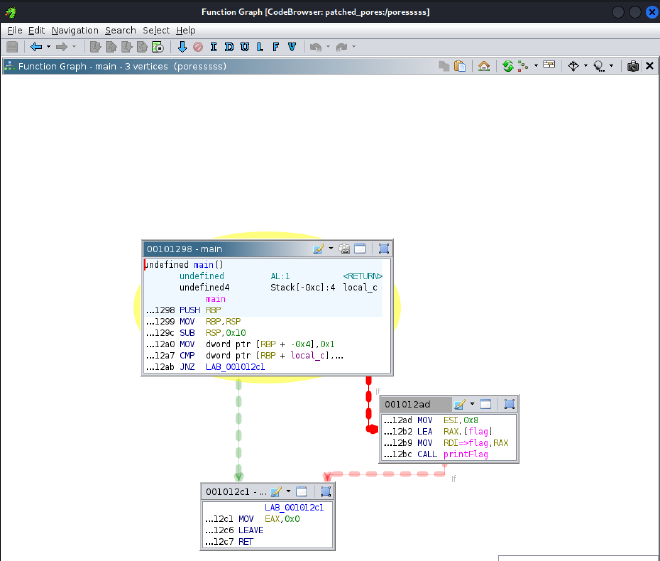
The function main() appeared to handle the program’s flow, but it didn’t call printFlag() directly. I needed to find how printFlag() was being triggered.
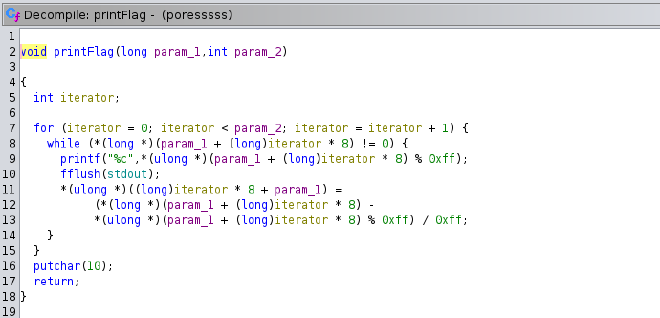
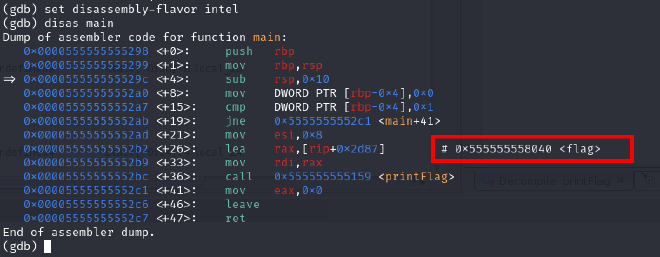
mov ESI, 0x08: This instruction loads the value 0x08 (which is 8 in decimal) into the ESI register. This value is likely used to represent the size or number of chunks that the program will work with when printing the flag.
LEA RAX, [flag]: The LEA (Load Effective Address) instruction loads the memory address of the flag variable (or data) into the RAX register. This is a pointer to the actual flag data in memory, and it is used as the first argument for the printFlag function.
mov RDI=>flag, RAX: This instruction moves the value from RAX (which holds the address of the flag) into the RDI register, which is used for the first argument in a function call (according to the x86-64 calling convention). Essentially, it is preparing the flag’s address as the first parameter for the printFlag function.
call printFlag: Finally, the call printFlag instruction transfers control to the printFlag function, passing the prepared arguments in RDI (the address of the flag) and ESI (the size, 8). This function, as per the analysis, is responsible for printing or revealing the flag.
Since main does not call printFlag, we can manually invoke it to execute it.
Step-by-Step Debugging Process:
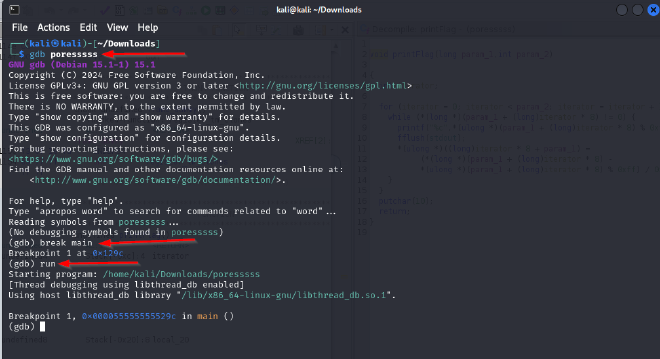
Load the Binary into GDB
We start by loading the binary into GDB for analysis.
Set a Breakpoint at main
Next, we set a breakpoint at the main function, which is where the program’s execution will pause.
Run the Program and Hit the Breakpoint
When we run the program, GDB pauses at the main function, allowing us to inspect the program’s state at this point.
Now that the program is paused, we have full control over its execution. This allows us to: View and modify memory, modify registers, continue execution, jump to different parts of the code, and much more!
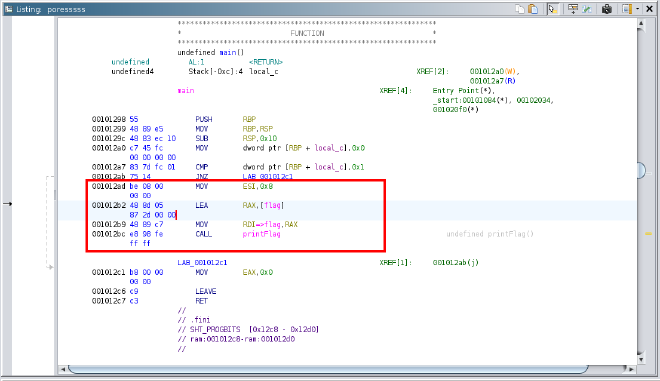
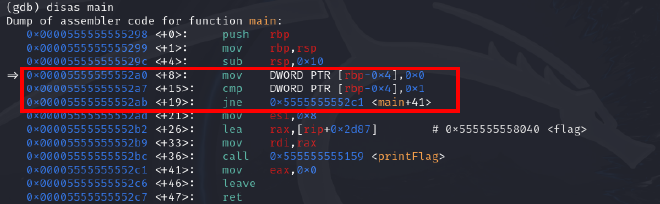
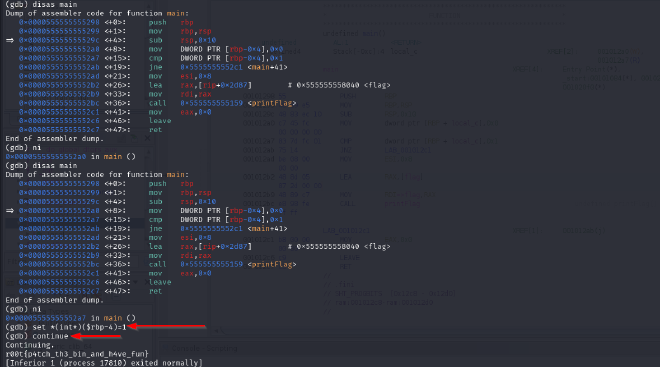
When we disassemble main we got the following control flow:
We can see that the flag is stored at address 0x555555558040.
I tried examining the string at that address using x/s 0x555555558040 but it gave me some non-printable ascii characters.
Modifying the program control flow by invoking the printFlag function #
Here’s how we do that:
Resuming Execution at printFlag:
We will modify the program’s execution by using GDB’s call command to jump directly to the printFlag function. This effectively simulates what would have happened if main had called printFlag normally.
Handling the void Return Type in GDB:
Since printFlag has a void return type, we need to ensure GDB recognizes it properly when invoking it manually. GDB does not automatically handle functions that return void, so we explicitly cast the function call to void to avoid errors. This ensures GDB knows we don’t expect a return value and prevents issues when invoking the function.
Passing the Right Arguments:
The printFlag function requires two arguments:
a. The address of the flag, 0x555555558040
b. The number of blocks (each 8 bytes) that the function needs to process, 8
In GDB, we call the function as follows:
And we get the flag :) r00t{p4tch_th3_bin_and_h4ve_fun}
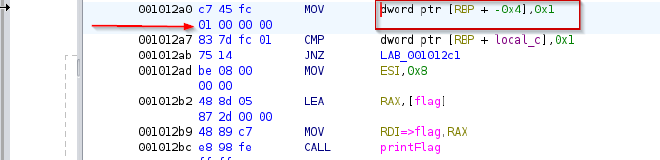
This is the standard function prologue. The base pointer (RBP) is pushed to the stack, the stack pointer (RSP) is moved to RBP, and the stack is adjusted to allocate space for local variables.
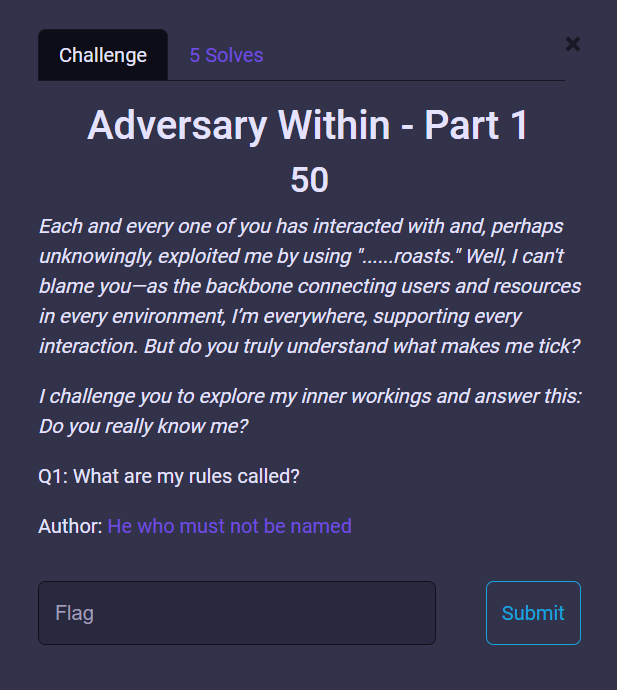
1. “…roasts”: This was the most telling clue. The term “roasts” is a subtle reference to Kerberos, the authentication protocol used by Active Directory (AD). In the context of AD, the term “Kerberoasting” refers to an attack technique where attackers request service tickets for service accounts in AD and attempt to crack them offline. The “roasts” here were a direct hint toward this attack method.
2. “backbone connecting users and resources in every environment”: This phrase clearly pointed to a system responsible for managing users and their access to resources in an environment. Active Directory (AD) is the most ubiquitous service for managing identities, permissions, and resource access in a network, especially in enterprise environments.
3. “I’m everywhere, supporting every interaction”: Active Directory is indeed the backbone of user authentication and resource management in virtually every corporate network, supporting all interactions that require authentication and authorization.
4. “What are my rules called?”: The reference to “rules” is crucial. In Active Directory, the schema defines the structure of the directory, including object types, attributes, and how those objects interact. The schema essentially sets the “rules” for how the data is organized and used in AD.